
There is so much data available to fundraisers today. For data nerds, it’s exciting. For everyone else? It can feel very overwhelming.
When it comes to your donation pages, you could track dozens of metrics—scroll depth, button clicks, time on page—but not everything that can be tracked actually helps you make better decisions.
If you don’t know what action to take from a metric, it’s probably not worth your time.
Instead, focus on a short list of Key Performance Indicators (KPIs) that tell you whether your donation page is working, and what to improve if it’s not.
Here are six donation page KPIs that are vital signs of a healthy fundraising page. They’re easy to track using tools you likely already have, and they’ll help you make smarter, more confident decisions (without drowning in data).
6 Donation Page KPIs You Should Be Tracking
1. Pageviews
One of the first, and simplest, things you want to track is pageviews.
In other words: Are people actually visiting your donation page?
If pageviews are zero, that’s an immediate red flag. The page may not be live, linked properly, or loading correctly. If pageviews are low, people may not be finding the page at all.
Tracking pageviews also helps you spot patterns. For example, you might see a spike after an email appeal, social post, or peer-to-peer fundraiser launches.
How To Track Pageviews
You can track pageviews using Google Analytics. In Google Analytics, navigate to Reports > Engagement > Pages and screens.
From there, you can search for your donation page URL and view pageviews across different timeframes (daily, weekly, monthly, or yearly).
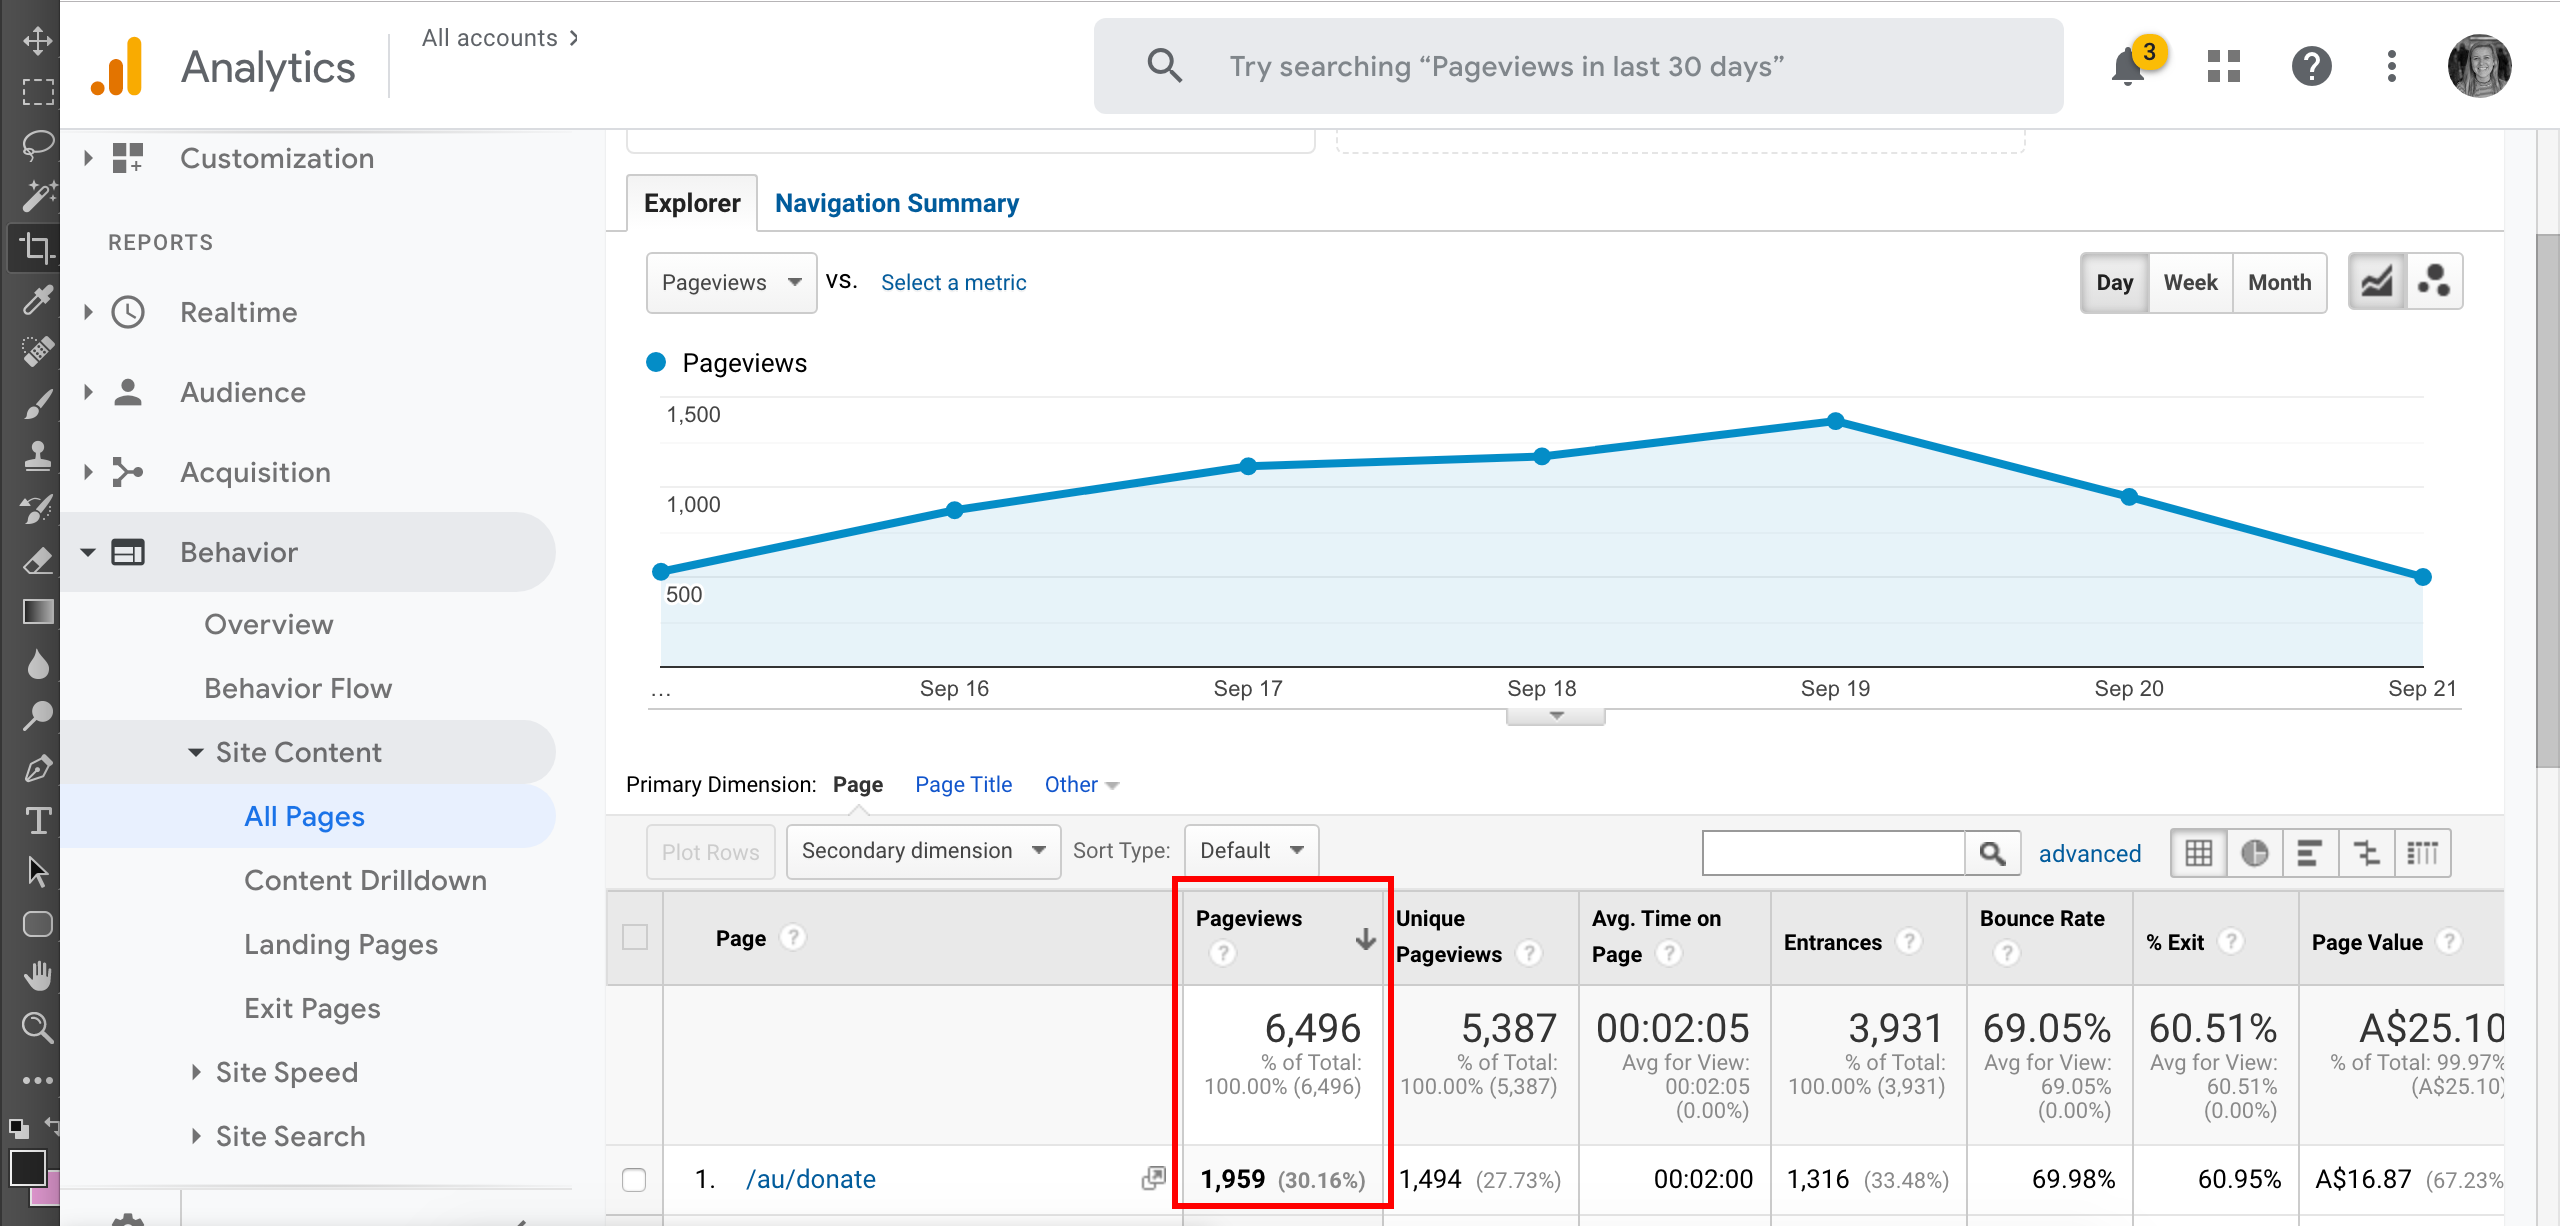
Here you can see the donation page has had 6,496 pageviews in the past week. You can toggle between different date frames as well to see weekly, monthly and yearly performance.
Pro Tip: To increase pageviews, link directly to your donation page in every campaign, email, social posts, text messages, and peer-to-peer pages. Don’t make supporters hunt for it.
With CauseVox donation pages, you can create a fully branded page with a clean, shareable URL and link it directly from your website navigation so it’s always easy to find. CauseVox also supports Google Analytics integration, giving you a clear picture of your donors’ behavior and your page performance.
2. Conversion Rate
Conversion rate is the percentage of visitors who land on your donation page and complete a donation.
This KPI tells you how well your page is doing its core job.
If your conversion rate is zero, investigate immediately as there may be a technical issue preventing donations.
If it’s low, your page may not be clear, compelling, or easy to use. Common culprits include too much text, unclear calls to action, or a donation form that feels clunky or untrustworthy.
How To Calculate Conversion Rate
You can calculate conversion rate manually by taking the number of donations ÷ number of page visitors.
You can even take it a step further by tracking conversion rate on a desktop vs a mobile device. Since a large portion of donors now give on their phones, it’s something worth tracking. In Google Analytics, you can do this by viewing your donation page and adding a comparison for Device category (mobile vs. desktop), then calculating conversions divided by pageviews for each.
Track your conversions on both mobile and desktop with Google Analytics.
If mobile conversion is significantly lower, it’s often a sign of friction, like too many steps, hard-to-use forms, or missing mobile wallet options, and a strong signal that simplifying the mobile donation experience will lead to more completed gifts.
Pro Tip: To improve your conversion rate, focus on creating a simple, seamless donation experience with as little friction as possible. Avoid forcing donors to click through multiple pages, make sure your form is fast and mobile-friendly, and offer mobile wallet options like Apple Pay and Google Pay. The easier it is to give, the more likely donors are to complete their gift.
3. Number Of Donors
This KPI tracks how many individual people donated through your page.
While it’s closely tied to conversion rate, it’s worth tracking separately, especially when you break it down into new vs. returning donors.
Knowing whether your donation page is helping you acquire new supporters or retain existing ones gives you valuable insight into long-term growth.
For example:
- A high number of new donors = strong acquisition
- A high number of returning donors = strong trust and loyalty
Both matter, and your donation page should speak to both audiences.
4. Cost Per Donation
Cost per donation helps you understand how efficient your fundraising efforts are. It’s calculated by dividing your total campaign spend by the number of donations received.
This KPI is especially important if you’re using paid channels like social ads or promoted posts, but it’s useful even for low-cost campaigns.
How To Calculate Cost Per Donation:
- Calculate by channel–Facebook, Google, Instagram, etc by taking your ad spend divided by donations from that channel. For instance, Facebook ads spend ÷ donations from Facebook would give you the cost per donation on Facebook.
- Calculate overall by taking your total spend ÷ total donations
Tip:
Email, peer-to-peer fundraising, and organic social sharing often produce the lowest cost per donation, especially when paired with a strong, easy-to-use donation page.
5. Average Donation Amount
Average donation amount shows the typical size of a gift on your donation page.
It’s calculated by taking total revenue ÷ number of donations.
The average donation KPI matters because you don’t always need more donors to raise more money. Even small increases in average gift size can significantly boost total revenue.
One of the easiest ways to influence this is through impact-driven donation tiers and good donor stewardship.

Descriptive giving tiers on a donation page help donors see the impact of their gift, encouraging them to be more generous.
Organizations using CauseVox donation pages regularly see higher average gifts when using donation tiers compared to generic payment buttons because suggested levels make the decision easier.
Pro Tip: Include a “stretch” donation amount, which is a higher option that anchors the page and nudges donors upward, even if they don’t select it.
6. Total Revenue
Total revenue is the KPI most organizations ultimately report on, and for good reason!
This number reflects how much your donation page raised overall.
Every KPI above feeds into this one. More pageviews mean more opportunities to give. Higher conversion rates mean more donors. Higher average gifts means more revenue per donor.
With CauseVox, you can track all donation revenue in one place, including online and offline gifts, so you always have a clear picture of campaign performance.
Customize what campaign data you want to see on your CauseVox admin dashboard
Sharing your total raised publicly can also boost results. Seeing progress builds trust, momentum, and social proof, all powerful motivators for donors.
Get More Insights Into Your Donation Page KPI With CauseVox
You can track all of these donation page KPIs (and more) using CauseVox donation pages and built-in reporting.
They’re easy to set up, fully branded, and designed to help nonprofits raise more—without adding more work to already-full plates.
Get started for free and see what a high-performing donation page can do for your next campaign.