If you haven’t been measuring your nonprofit’s website performance, there’s good reason to start doing so sooner rather than later. Especially if you’re considering a redesign of your nonprofit’s website.
Why? Because in today’s world, people want information quickly.
When visitors to your website experience issues such as slow loading times, missing/inaccurate information, or unclear formatting, it’s likely that they won’t stay very long. And unfortunately, that can result in a loss of visitor engagement and even donations.
Therefore, your website analytics can teach you about what is and isn’t connecting with your audience, and show how you can better connect with them in the future.
In order to get a clear picture as to how efficiently and effectively your website is running, you’ll want to look at website performance factors such as page speed, as well as information about your visitors.
This data can be captured fairly easily, and having it can work wonders in helping you understand what is appealing to your website’s audience.
Some people feel intimidated by topics such as website analytics. I’ll admit that the concept seemed pretty foreign to me a while back too. But, I swear, you too can measure your nonprofit’s website performance if you know what to look for.
Here’s a quick rundown of what you need to know when measuring your nonprofit’s website performance.
Before we dive into the data you need to capture, it’s helpful to know exactly where to find this data.
Some popular ways to capture data include:
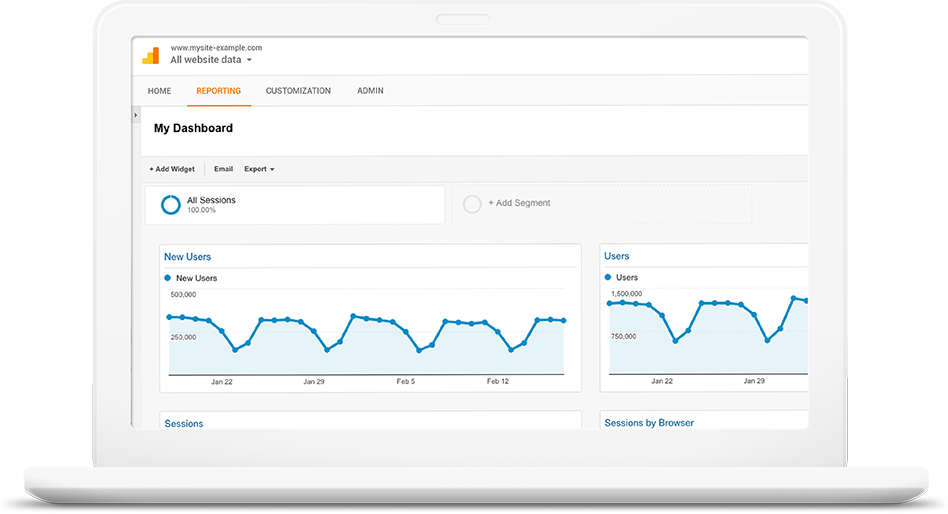
1. Google Analytics– Many nonprofits are familiar with this highly popular, user-friendly, and considerably extensive data tool. Simply set up an account and link up your nonprofit’s website (or websites) and you’ll immediately start tracking information that identifies your website visitors and sources of traffic.
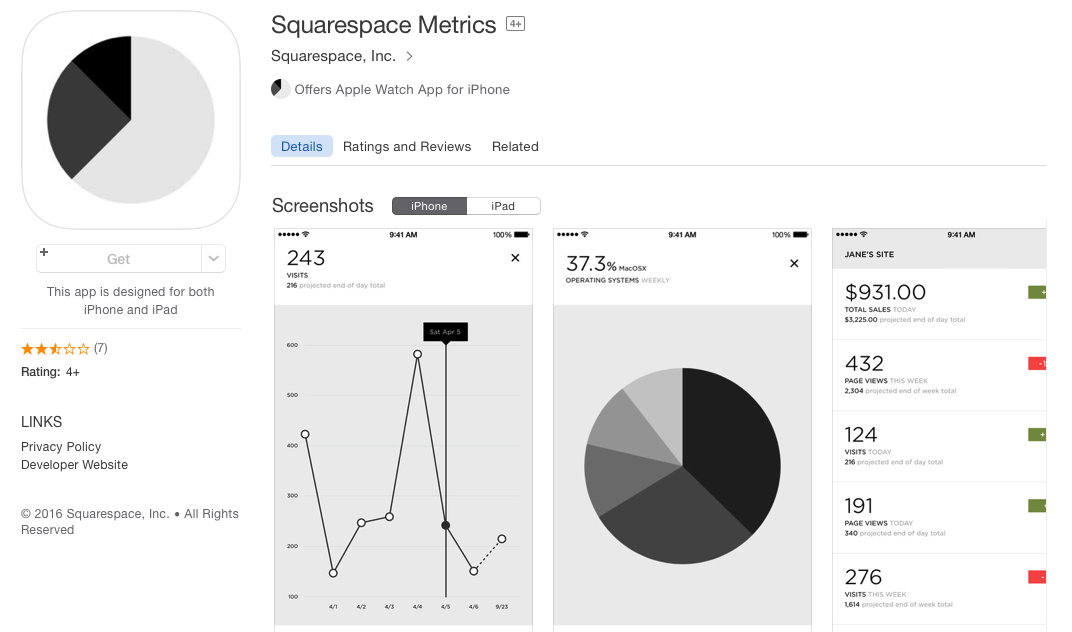
2. Website Analytics Tracker– The platform on which you host your website may provide you with basic analytics. For example, SquareSpace offers Squarespace Metrics, which will track your key performance indicators, letting you know essential information about your views, unique visitors, and audience insights.
For an extensive list of website analytics tools, check out this site
Once you begin to use one of these data trackers, you will begin to notice trends in your users such as how they are coming to your website, and what they are doing there.
Now that you know which tools are available to start tracking your data, it’s time to dive into the basic performance and demographical data that you need to be aware of.
Depending on the analytics tool you are using, you should be able to locate a majority of this data on your dashboard.
It may seem like a ton of information to gather, but as you go through the steps of measuring your website performance, you’ll soon realize that all the data you need is available if you’re using the right tools.
Once you get a baseline of data, continue to track your statistics over time. Pay attention to any spikes in the number of visits, the average length of time on the site, and each page popularity so that you can design your website to appeal to your average visitor.
You may find that your website is working great and find a few ways to improve or you may realize that you’re in need of a major redesign. Either way, you’ll have the data to back your decisions!
Ever wished your donations could go even further? Enter automated matching—an indispensable tool that transforms…
Chances are, you know what Giving Tuesday is by now. However, it's important to recognize…
Here at CauseVox, we love a good success story. And we couldn’t think of a…
Do you ever go grocery shopping and see a product that feels like it was…
Hosting your own giving day is a powerful way to amplify your mission. At CauseVox,…
From Giving Tuesday to World Diabetes Day, giving days stand out as events that bring…