Fundraising is an ever-evolving art. During my years in development, the idea of organizing an online crowdfunding campaign was foreign, a donor-centric engagement strategy was still in the works, and peer-to-peer fundraising was completely out of the question.
It was all bubbling under the surface—but we just weren’t there yet.
But since early on in the 2010s, development trends have rapidly advanced. Some of these changes are due to the increase of technology and the growing influence of the Internet, but others are directly related to the changing donor population.
Whether you’re ahead of the curve or feel like you’re still in the Stone Age of fundraising, there’s a happy medium out there. The key is to use data to fuel your fundraising efforts.
One of my favorite sources of data is the Global Trends In Giving Report, which is sponsored by the Public Interest Registry and researched by NP Tech for Good. It’s full of donor-specific data from around the world and touches on both online and offline giving.
They just released the 2018 report, and it’s an amazing resource. Here are 11 takeaways that may matter to you as you finalize your year-end fundraising efforts and prepare for 2019.
1. Community-Driven Fundraising
Data: 14% Of Donors Have Created An Online Peer-to-Peer Fundraising Campaign
Our donors are bombarded with messages on a near-constant basis. They hear from other nonprofits, brands, and people; all of them asking to “look at what we’re doing,” “buy our product,” “look at me.”
It’s a noisy world, and nonprofits are contributing to it.
To stand out, nonprofits need to look past mass marketing and focus on spreading word organically through community-driven fundraising. When you engage your supporter base to inspire, activate, and rally others to get involved, you’re mobilizing others to grow your community!
Peer-to-peer fundraising is a popular community-driven fundraising technique because it:
- Raises money for your cause
- Mobilizes your community
- Grows your community.
Per the 2018 Global Trends in Giving Report, 14% of donors have created an online peer-to-peer campaign, which confirms that this particular type of campaign is becoming more common.
Action Step: Consider adding a peer-to-peer campaign to your annual fundraising plan.
2. Recurring Giving
Data: 45% Of Donors Are Enrolled In A Monthly Giving Program
Recurring giving, also known as monthly giving, makes a lot of sense. When donors give on an ongoing basis, they’re more likely to stay engaged, and your cause remains at the top of their mind. Plus, you reap the reward of more money over the course of the year as opposed to a one-time gift.
The 2018 report found that close to half of all donors are enrolled in a monthly giving program. This is great data because it indicates that many donors are willing to commit to an organization they care about on a long-term basis.
If you’re looking to boost your retention numbers, a monthly giving program may be your ticket to success.
Action Step: Create or expand your monthly giving program.
3. Payment Preferences
Data: 54% Of Worldwide Donors Prefer To Give Online With A Credit Or Debit Card
Long gone are the days when your donor would hand over an envelope full of cash or even a check. Today, credit and debit card transactions rule.
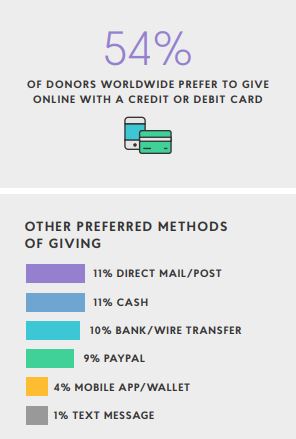
In North America, the gap between those who prefer to give online with a credit card (60%) versus cash (6%) is gigantic.
What does this mean for you? This data indicates that it’s definitely time to ramp up your online giving options since this is where the vast majority of donors want to give.
Action Step: Ensure your online giving methods (donation page, online fundraising websites, “Donate” buttons) are all in working order. They should be easy to access and intuitive.
4. Lifestyle Choices
Data: 72% Have Charitable Giving In Their Last Will & Testament and 91% Vote Regularly
Have you ever wondered if there was a “typical donor?” Well, you’re in luck. The Global Trends in Giving Report found that there are striking similarities in the lifestyle choices of the typical donor. Some standout choices include:
- Voting (91%)
- Adding charitable giving to their last will and testament (72%)
- Volunteer (67%)
- Recycle (92%)
- Sign Online Petitions (72%)
As you can see, these trends indicate that today’s donors aren’t just looking to support change; they want to be a part of it. They’re making concerted efforts to do their part.
Armed with this data, you can improve your communications toward your target audience.
Action Step: Promote these lifestyle choices in your marketing and communications. If you’re looking for a way to track this sort of data, learn more about how CauseVox supports this type of holistic fundraising with this webinar.
5. Social Media Platforms Inspire Giving
Data: 56% Facebook, 20% Instagram 13% Twitter
The influence of social media on fundraising cannot be overstated. It’s an essential way we communicate with supporters, share data, fundraise, inspire, and rally.
But managing three, four, even five social media platforms at any moment eats up a lot of valuable time.
How do you choose which social media platforms are worth the effort? Look at the data!
The report found that the three social media platforms that most often inspire giving are Facebook, Instagram, and Twitter. On the other hand, YouTube, LinkedIn, and WhatsApp all lag behind their peer platforms.
Social media isn’t just where you communicate with supporters; it’s where they communicate with their peers, recommend brands and products, and stay connected with the world. In many cases, new supporters learn about your cause from their friends and family on social media. These online platforms tap into your supporter’s influence to grow your audience organically.
Action Step: Determine if you’re using the right social media platforms for your audience and adjust as need be. Ask you supporters to share your content and voice their support on social media.
6. Donation Size Trends
Data: Smaller Donations More Often Inspired By Social Media, Whereas Larger Donations More Often Inspired By Email
Social media fuels smaller donations. In fact, the 2018 Global Trends in Giving report found that social media inspired 40% of all donations under 100, and 29% of all donations between $101 and $1,000.
Email was the catalyst for 33% all donations over $1001, and social media only fueled 13% of donations over $10,000.
There’s a direct link between communication methods and donation size. If you’ve ramped up your social media outreach, and noticed a drop in donation size, then beef up your email fundraising.
Action Step: Track donation size and how that donor came to give through a relationship-based CRM program. Then, adjust your methods to maximize gift amounts.
7. Easy Thank You’s
Data: 68% Of Donors Prefer To Be Thanked By Email, 20% Print Letter, 5% Print Postcard, 3% Social Media, 3% Text Message
I love a good handwritten note. They make my heart feel happy. And in the world of development, there’s a lot to be said for this method of thanking.
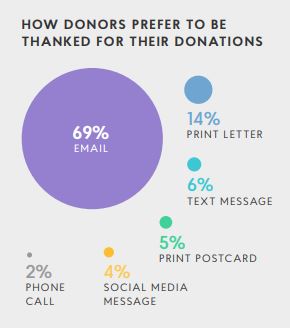
However, donors are speaking, and they’re telling us that a personal email is their preference. A vast majority of donors (68%!) want to be thanked over email as opposed to a letter or text message.
So if you’re swamped and can’t write another thank you note, then don’t feel guilty about sending an email instead.
Action Step: Diversify your thank you methods, and focus on email to communicate.
8. Communication Matters
Data: 56% Of Donors Say They Are Most Likely To Give Repeatedly To An Organization If They Receive Regular Communication About The Work The Organization Is Doing And The Impact Of Their Donation
Donors don’t just want to be asked for money; they expect you to follow up and tell them exactly how you used that money.
But throw those pie charts out the window, because your donor doesn’t want to see numbers. They want to see impact. Never underestimate the power of a donor-centric impact story.
Action Step: Send all donors of every level information about their gift’s impact.
9. Online Trust
Data: 73% Of Donors In North America Are More Likely To Trust Organizations That Use .org Domain Extension For Website And Email
Successful nonprofits build trust between the organization and its supporters. Fiscal responsibility and transparency are vital, but seemingly smaller factors also come into play when you’re building trust.
And one of those is your website.
If your website isn’t clean, orderly, transparent, and official, then it’s hard to stand out in a crowded nonprofit field.
Action Step: Use a .org domain extension for your website and email. While you’re at it, go ahead and refresh your website and create a standard email footer for everyone working at your organization.
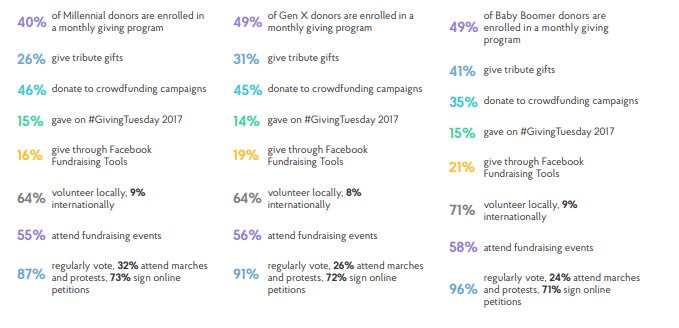
10. Generational Differences
Data: Millennials & Generation X Are More Likely To Give To Crowdfunding Campaigns, But Boomers Are More Likely To Give To A Facebook Campaign
Not surprisingly, there are differences in the way each generation likes to give. We learn from the 2018 report that crowdfunding campaigns are more popular with Millennials and Generation X than Baby Boomers. However, Boomers are much more likely to donate to a Facebook campaign than Millennials.
Interesting, right?
As someone who loves to understand the subtle differences between generational giving habits, this report threw me for a loop. Take a look for yourself, and a see if you’ve noticed any of these trends.
Action Step: Understand your target donor, and adjust your methodology to appeal to them using this data. This webinar on Community-Driven Fundraising also has some great generational takeaways to help your efforts.
11. Typical Donor
Data: The Worldwide Donor Community Is Made Up Of Women (65%), Liberal Ideology (53%), Who Are Religious (72%), And Give Between $101 and $1000 annually (43%).
Your nonprofit’s typical donor looks different from any other organization. However, the 2018 report found clear similarities between typical donors.
They’re overwhelmingly female, liberal, religious, and give small gifts. Children and youth (15%) causes tug at their heartstrings, followed by health and wellness (11%), and animals (11%).
Why does this matter? Understanding who you’re communicating with can help you improve your marketing and fundraising efforts. For example, if you’re planning a fundraising event, you wouldn’t want to set a date for a Sunday morning if the majority of your donors head to a place of worship.
Action Step: Look at your donor data, find similarities, and then streamline your communications accordingly.
This report is a goldmine of information for nonprofits in the United States and across the world. Consider the data here, but then compare it your own data. Spend the time to learn about your donors, their giving habits, and the ways they’re inspired.
The more you know, the better prepared you’ll be to meet the expectations of your donor population.
If you liked this post, check out these additional CauseVox resources: