Guest post by WholeWhale.
Whole Whale is a digital agency that leverages data and technology to increase the impact of nonprofits. In the same way the Inuits used every part of whale, WW leverages data and tech to increase organizational impact and reduce waste. By using data analysis, digital strategy, web development, and training, WW builds a ‘Data Culture’ within every nonprofit they work with. Here’s how the idea of Whole Whale began. Contact: LetsTalk@WholeWhale.com
Julie Leary, Whole Whale’s Digital Strategy Whaler, spoke about the power of data analysis to help you become your own social media guru at the Social Media For Nonprofits Conference in New York City on July 21st. Hear more about data analysis from the experts now!
A Beginner’s Guide to Twitter Analytics
If you’re looking for data to inform your social media strategy on Twitter, Twitter Analytics is a great (and obvious) place to start. You can learn everything from how your following has grown all the way to conversion tracking on your website.
While Twitter Analytics doesn’t collect as much data as Facebook Insights, the data speak volumes–if you know how to listen. You aren’t Twitter-literate, you say? No worries. In this article, we’ll help illustrate how to have a conversation with your data. We all know that communication is the key to a healthy (data) relationship. Knowing what questions to ask your data will help you improve your Twitter content strategy and let your data know that you truly care.
To access your Twitter Analytics, simply go to analytics.twitter.com. At the top, you’ll notice tabs for “Tweets” and “Followers.” These are the sections which we’ll be focusing on, as Twitter Cards are a bit more involved. Ready? Here we go.
1. How is our following growing?
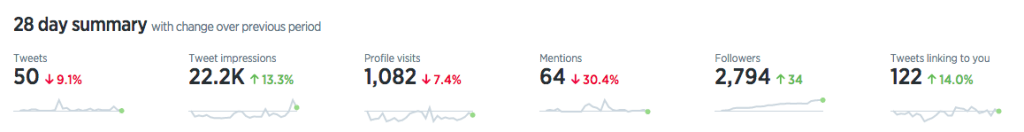
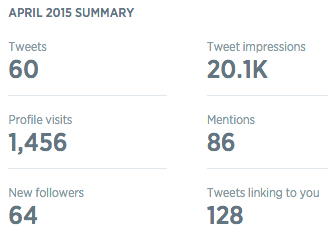
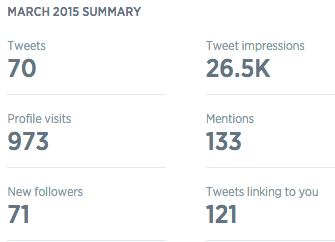
The first data you’ll see in your Twitter Analytics “Home” section will look similar to screenshot above. It shows you the number of tweets, impression, profile visits, mentions, followers, and tweets linking to you that your account received in the last 28 days and compares that data to the previous period. The “Home Tab” also offers a monthly summary so you can watch your growth month over month. You’ll find these summaries on the right side of the page below the 28 day summary.
If you want dive a little deeper into engagement growth, click on the “Tweets” tab and on the far right side you’ll see a daily breakdown of engagement rate, link clicks, retweets, favorites, and replies.
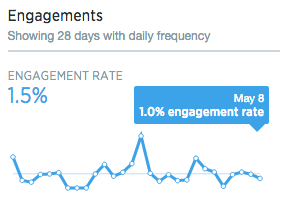
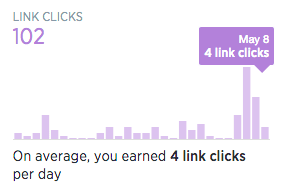
You’ll notice that all of these data graphics are fairly intuitive and don’t require any advanced degree in statistics to decipher. All that is required is knowing what to look for and knowing how to use this information to make change.
Questions to ask your data:
On which days did we get a lot of mentions?
Was there any period that lagged in new followers?
Is our growth consistent and sustained?
Actions:
- Once you get the answers from your data, the next step is to discover the reasons behind these trends. For instance, ask yourself: why was there a spike in engagement rate on April 25th? Did you post something controversial? Did you use a specific hashtag? Did a celebrity or someone with a lot of followers RT you?
- Find out what factors and actions drove such successes and seek to replicate them. Similarly, if you experienced a period where a lot of followers dropped, find out what went wrong and stop doing that.
2. What is our best content?
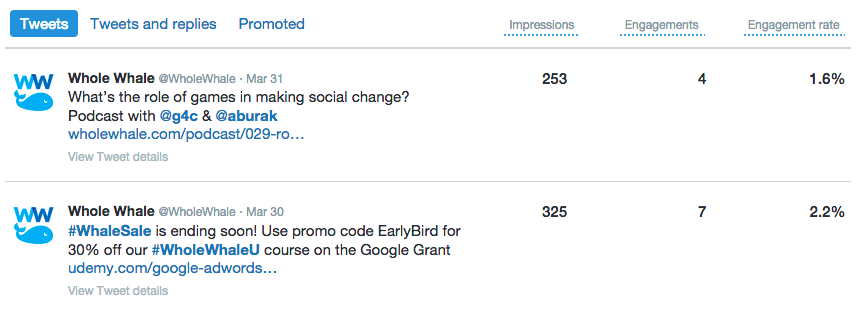
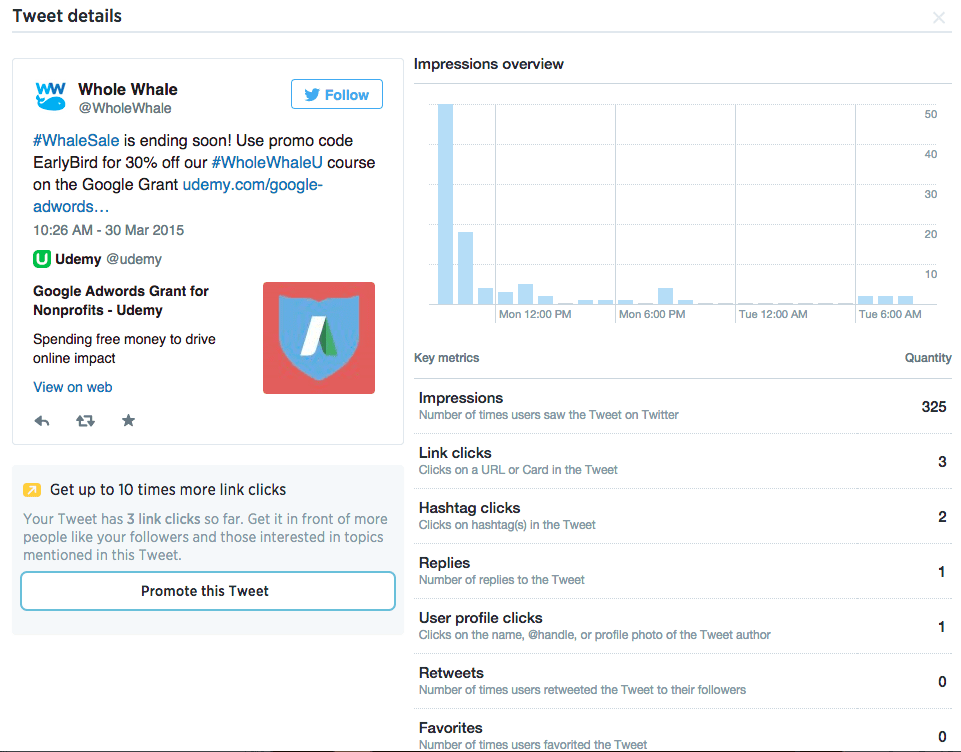
Twitter Analytics allows you to get a quick overview of your most engaging tweets. The overview shows you which of your tweets had the greatest number of impressions, engagements, and best engagement rates. If a specific tweet did poorly or really well, click on “View Tweet Details” to get an in-depth look at that tweet’s engagement. You’ll see impressions by the hour, detail expands (people clicking to read more), link clicks, favorites, retweets, and replies.
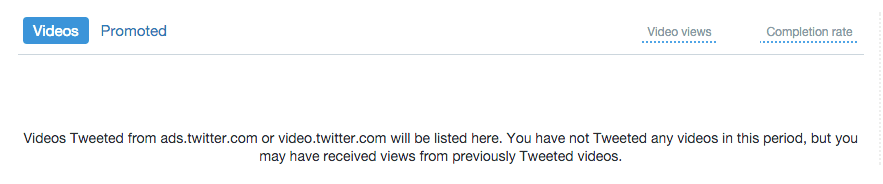
If you also post videos on Twitter, there is a new video analytics section currently in beta. You can find video analytics by clicking on the “More” tab:
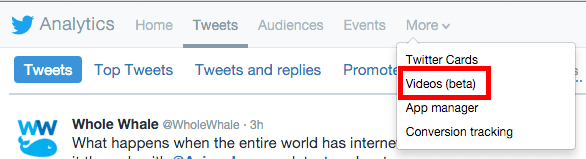
The new “Videos” section looks similar to the “Tweets” section of Twitter Analytics. Here you can see videos views and completion rate broken down by specific videos and the larger video trends for your audience like total minutes watched and retention rates – users start a video, how many get to 25% watched, how many get to 50% watched, how many get to 75% watched, and how many watch the whole thing.
Questions to Ask:
Is there a post style that leads to high engagement?
Is there a #topic that gets above-average retweets?
Is there a certain time of day or day of the week that tends to have higher engagement rates?
Action:
- Wondering what the social strategy for your organization should be? Use the answers to these questions to develop a fun and engaging voice for your organization.
- If photos get the most engagement, post them.
- If posting about recent news events gets the most retweets, talk about them.
- Notice that a particular person has consistent interaction with your organization on Twitter? Engage with them. Mention them in your tweets.
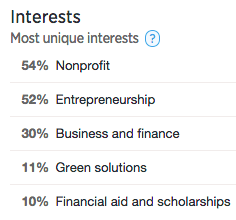
3. What are our users interested in?
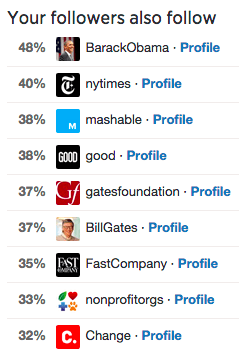
Knowing the demographics of your followers can and should help inform content creation. Through checking out who influences them, you can figure out what topics and ideas are most relevant to them. At the same time, it is important to maintain a distinctive voice for your organization and to make sure that your tweets are related to your unique service. You can find key demographic information in the “Followers” tab. Here you’ll find gender, top interests, and the top individuals your followers also follow.
Questions to ask:
What is our primary demographic?
Which figures are our followers interested in?
What do we have in common with those figures?
Does our content match our users’ interests?
Action:
- Envision your follower types and try to think about what things they may be interested in. Create social personas including interests, post them above your computer when you’re creating content.
- Consider who influences your audience. You can reference these figures in ways that relate to your organizations and you can even try tweeting at these figures.
- Identify what topics interest your users most and tweet about them more.
“Twitter Analytics let’s you identify what topics interest your followers so you can tweet about them!” tweet this
4. When and where should we be active?
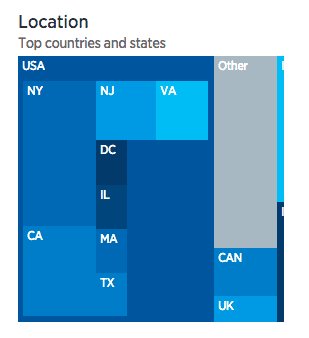
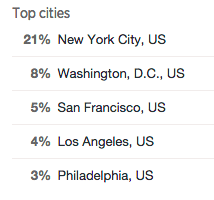
Again, Twitter Analytics provides us with more useful data about the demographics of your followers. Analyzing where your followers reside can help show your nonprofit how far-reaching your impact is.
Question to ask data:
Where do our followers come from?
Have we grown beyond a local appeal?
Action:
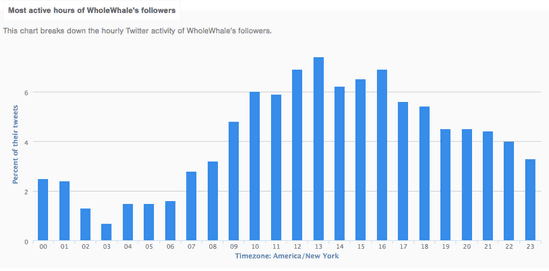
- Tweet at a wider range of times to account for your fans across different time zones
- Consider what topics might interest someone in your top city (i.e. sport team of that city). Don’t just get stuck speaking from a national perspective.
- Bonus: Check out what time your followers are active on Twitter using Followerwonk. Don’t worry. It’s free! You’ll notice below that over 40% of our followers’ Twitter activity takes place outside of our 9-5 hours.
#Conclusion
Remember: The data will only give you clues about your organization’s performance. You have to “read between the lines” (of data). It is your job to put on your detective hat and search for the real answers. Without the metrics however, it is near impossible to get this process underway. Go ahead, your data is begging for some interaction. Strike up a conversation!
“Hey, don’t forget to read between the lines of your Twitter Analytics!” tweet this
Originally published at: https://www.wholewhale.com/tips/4-essential-questions-twitter-analytics-can-answer/
Editor's Picks
Ultimate Guide To Peer-to-Peer Fundraising
Customer Story: Spur Local Raises Over $1M With Their Give Local Campaign
Fundraising Strategies for Nonprofits: Craft the Best Approach for Your Organization
Create a Killer Fundraising Plan - Best Practices, Strategies, & Downloadable Template